Meta-analysis of datasets available in public repositories are used to gather and summarise experiments performed across laboratories, as well as to explore consistency of scientific findings. As data quality and biological equivalency across samples may obscure such analyses and consequently their conclusions, we investigated the comparability of 85 public RNA-seq cell line datasets. Thousands of pairwise comparisons of single nucleotide variants in 139 samples revealed variable genetic heterogeneity of the eight cell line populations analysed as well as variable data quality. The H9 and HCT116 cell lines were found to be remarkably stable across laboratories (with median concordances of 99.2% and 98.5%, respectively), in contrast to the highly variable HeLa cells (89.3%). We show that the genetic heterogeneity encountered greatly affects gene expression between same-cell comparisons, highlighting the importance of interrogating the biological equivalency of samples when comparing experimental datasets. Both the number of differentially expressed genes and the expression levels negatively correlate with the genetic heterogeneity. Finally, we demonstrate how comparing genetically heterogeneous datasets affect gene expression analyses and that high dissimilarity between same-cell datasets alters the expression of more than 300 cancer-related genes, which are often the focus of studies using cell lines.
As the number of gene expression experiments continue to increase, so do the availability of datasets in publicly available data repositories, such as the Gene Expression Omnibus (GEO) 1 . Comparisons of in-house data and public datasets enable researchers to contrast their results to existing information in a biologically meaningful way, while meta-analyses of public datasets can yield biologically and technically relevant information that the individually analysed constituent datasets cannot 2 . The scientific context of different studies vary greatly, but the chosen context does not, however, preclude the possibility of subsequently investigating other scientific questions, making re-analysis of previously published data an important venture to achieve novel insights 3 . Indeed, some of the earliest “Big Data” articles’ citations have been mainly attributed to novel results from re-analyses of the data rather than the original conclusions themselves 4 . Re-analyses are also an efficient use of scientific resources, as new conclusions can be drawn without needing to perform new and costly sequencing experiments. Integration of different data types (e.g. transcriptomics and genomics) is also becoming more relevant, as they can reveal a more complete biological picture 5 . Integration of data collections are especially important, since they can yield insights into biological questions difficult to assess by direct experiment 6 . Before any such project can start, however, investigations need to be made to ensure that included datasets are comparable. There are several reasons why a dataset might be disqualified from inclusion, such as low data quality or non-equivalent biological sources 2 .
Cell lines are commonly used as in vitro models for cancer and drug testing, but a considerable problem is that of cell line authenticity: whether or not the cells used are biologically equivalent to their original source 7 . While cell lines are excellent, easy-to-use sources of unlimited experimental materials that side-steps the ethical and practical issues related to using human samples, authenticity remains a major concern. Unauthentic cells can arise because of several reasons, such as cross-contamination by another cell line, mislabelling at the lab or genetic drift due to long-term culturing. It has been shown that between 15% and 20% of all cell lines are misidentified or contaminated 8 . Mycoplasma infections also affect the cells, but can be avoided by performing routine tests and using proper culturing techniques 9 . The HeLa cell line is among the most frequent sources of cross-contamination due to its ubiquitous use in laboratories across the globe. Not only do problems arise during culturing and experimentation on cell lines, but it is now apparent that many have become contaminated at the time of their creation 10 .
Analysing short tandem repeats (STRs) in the cell line of interest and comparing the results to a database is the de facto standard recommended by the American Type Culture Collection (ATCC), but analysis of single nucleotide variants (SNVs) is also becoming increasingly used 11,12 . There are, however, problems with using STR profiling as the basis for cell line authenticity, such as microsatellite instability and genetic heterogeneity 13,14 . Researchers have recently shown that a batch of the MCF7 cell line possessed genetic heterogeneity that affected its phenotype, while still yielding a perfect STR match to the ATCC reference 15 .
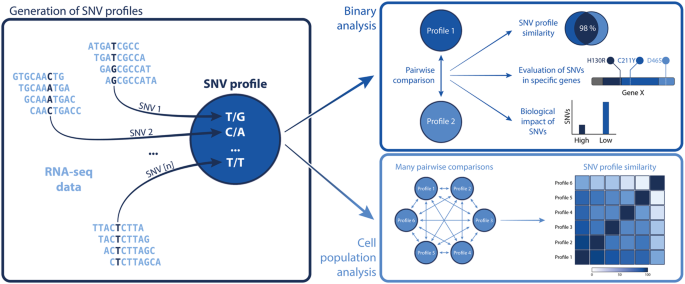
As RNA sequencing (RNA-seq) has been shown to be highly robust across both platforms, laboratories and experimental designs 16 , we previously developed a method to analyse RNA-seq for cell line authentication 17 . The method uses the vast amounts of sequence information available from RNA-seq experiments to compare variants with the Catalogue of Somatic Mutations in Cancer (COSMIC) database on a larger scale than conventional STR or SNV profiling does 18 . While SNVs are traditionally analysed with genomic methods, it has previously been shown that 40% to 80% of variants discovered using whole genome sequencing are also found by RNA-seq 19 . There are numerous studies empirically proving that RNA variant analysis can yield novel biological insights 20,21,22 . This highlights the ability of RNA-seq to also be used for variant analysis (in addition to standard gene expression studies), greatly increasing its utility. One of the strengths of the method is its capacity for re-analysis of existing sequencing data, allowing it to investigate any publicly available RNA-seq datasets as well as novel data. Another advantage is its potential to analyse variants across the entire transcriptome, rather than a preset number of STRs or SNVs, thus greatly increasing its statistical power. In addition to filling the need for new and robust methods for cell line authentication highlighted by Freedman et al. 23 , the method both authenticates cell lines to a high degree of certainty as well as provides detailed information about deviations from known variants in the cells. We also demonstrated that our method could potentially be used for transcriptome-wide authentications, taking the totality of overlapping SNVs in each dataset into account. This would represent an improvement over e.g. STR panels, as the global analysis of individual mutations is important for many diseases 24 .
Herein, we present one of the largest studies of genetic heterogeneity and comparability in public datasets to date using the previously published method, performing several thousands of pairwise comparisons of 139 samples across 85 RNA-seq datasets and eight cell lines in the GEO. We characterise the varying degrees of genetic heterogeneity present in the different cell lines and confirm that this heterogeneity has an effect on gene expression and cellular functions, reveal that H9 and HCT116 are remarkably stable while HeLa possesses a high degree of variation, and highlight a mislabelled MCF7 dataset. We thus demonstrate the importance of checking that public data used for new analyses are based on biologically equivalent sources and provide a general workflow demonstrating how this can be achieved.
In order to investigate the comparability of cell line data, the GEO was queried and filtered to only include cell lines with at least ten RNA-seq datasets to ensure statistical power and a collection of samples representative for the cell line populations currently used in research. The cell lines were additionally required to be available in the COSMIC database. Due to the nature with which metadata is stored in the GEO this process had to be performed in several steps, the last of which required manual curation. Datasets were chosen to yield at least 50 × 10 6 reads on average across one or more samples in order to control for biases in sequencing depth, contain a mix of single- and paired-end data and to be of “wild type” origin; samples that contained gene knockouts, genetic transformations, treatments or other perturbations (according to the metadata) were ignored, as such samples could confound the underlying biology being compared. A total of 139 samples from 85 different datasets and eight cell lines were selected to be analysed (Table 1): A549 (lung carcinoma), H9 (lymphoma), HCT116 (colon carcinoma), HeLa (cervical adenocarcinoma), K562 (leukaemia), MCF7 (breast adenocarcinoma), MDAMB231 (breast adenocarcinoma) and U2OS (osteosarcoma).
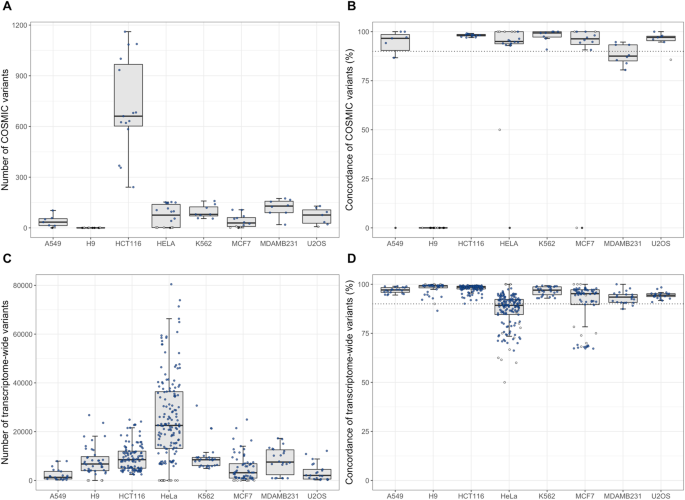
In order to measure the similarity between the RNA-seq variants and the COSMIC profiles, the concordance is defined as the proportion of matching SNVs (i.e. SNVs with the same genotype in both samples) relative to the overlap (i.e. SNV matches ÷ total SNV overlaps). Six out of seven cell lines (discounting H9) have a median concordance above 90% (a previously employed threshold for cell authenticity) 12 , while MDAMB231 has 87.6% (Fig. 1B). Four cell lines (A549, HeLa, MDAMB231 and U2OS) have at least one dataset with an individual concordance below 90% (SFigure 1). Concordance CVs range from 0.6% to 46.8%, indicating an inherent variability in COSMIC SNV comparisons (Table 2).
The number of variants differing from the COSMIC database does not, however, necessarily reflect the biological effect of the mismatched SNVs. The annotated SNV impacts (HIGH, MODERATE, LOW or MODIFIER, where HIGH impact variants have negative effect on protein function) more clearly reflect the biology of the SNVs. The distribution of matched and mismatched SNV impacts is comparable to previous cell line data (SFigure 2). However, a large proportion of the mismatched COSMIC SNVs are homozygous variants (83.2%; SFigure 3), indicating that there is a difference between the COSMIC database and the RNA-based SNVs found in the datasets.
These results indicate that the COSMIC-based cell authentication method is useful, but that its coverage of annotated SNVs is insufficient for a thorough investigation of dataset comparability.
By examining transcriptome-wide SNVs instead of only considering annotated COSMIC variants the analysis will gain statistical power and create opportunities for functional assessment, in addition to provide opportunities for completing and adding to the COSMIC data. Such an analysis can capture biological variation in entire cell line populations and better highlight problems with data quality. We thus performed several thousands of transcriptome-wide, pairwise dataset comparisons using the totality of the high-quality SNVs from the variant calling pipeline. Boxplots of the total number of overlapping variants and the concordance for each comparison is shown in Fig. 1C,D. As can be seen in Table 3, there are thousands of transcriptome-wide variants found in the different datasets, ranging from over 100,000 overlapping variants for HeLa to 1,280 for A549. The median overlapping variants of comparisons between different cell lines is 3,569, with a median concordance of 65.2%, yielding an estimate of the baseline similarity between two arbitrary cell lines. A concordance of approximately 65% is thus a strong indication that the two cell lines being compared are not equivalent.
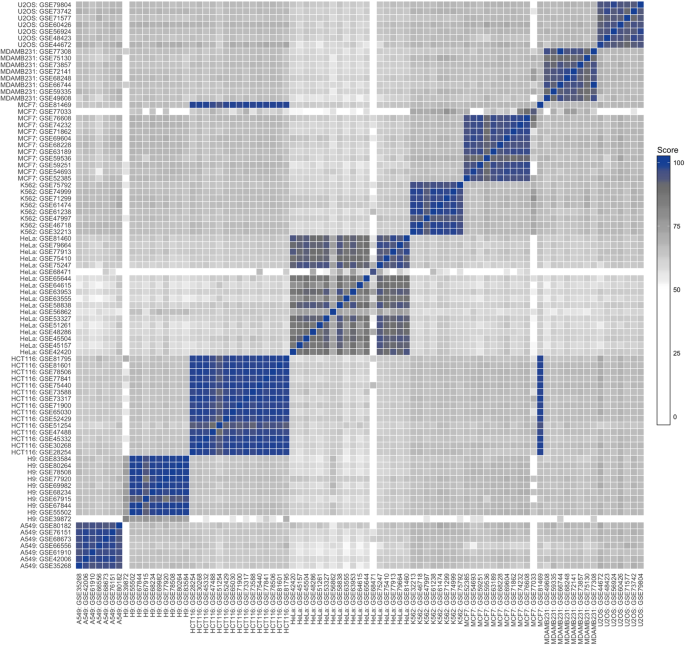
The three datasets that showed mixed concordances are seen as mostly blank columns/rows, highlighting their deviation from the bulk of datasets and need for further investigation. The reason for the low number of variants in the GSE39872 dataset (H9) could be due to the imprecise manner in which metadata is submitted and stored in the GEO: the molecule and library strategy metadata columns (which were used as selection criteria) are listed as “total RNA” and “RNA-seq”, respectively, but details in the corresponding article reveals that this data is of small RNA-seq origin, which explains the low number of variants resulting from this dataset. The GSE68471 dataset (HeLa) is likewise listed as “total RNA”, but is in fact from low complexity histone-specific libraries from a method for sequencing 3′-ends of RNA, while the GSE77033 dataset (MCF7) uses nanoCAGE 26 , a method for identifying 5′-ends of transcripts and discovery of new promoters. These three datasets, in addition to the mislabelled MCF7 dataset, are not included in any subsequent analyses.
Taken together, these results demonstrate that transcriptome-wide variant analyses efficiently capture the biological variation needed to investigate genetic heterogeneity and dataset comparability, as well as its capacity to highlight problems in data quality and metadata storage.
The transcriptome-wide analyses demonstrate that the different cell lines have distinct degrees of heterogeneity: H9 and HCT116 are highly stable across datasets, while the others are more variable. These results raise the important question as to whether comparability of multiple datasets as defined in our study obscures or alters the results of common transcriptomic analyses. We thus performed differential gene expression analysis on each pairwise, same-cell dataset in order to evaluate the effect of the genetic heterogeneity present in public cell line datasets. As abundance measures (such as TPM, “transcripts per million”) are commonly available in many expression databases, this analyses was performed using the Kallisto software for isoform abundance estimation 27 . These abundances were subsequently summed to the gene-level by the TXimport R package and analysed with edgeR for differential expression, as it has been shown that such workflows have high accuracy 27,28,29,30 . Only datasets with at least two replicates were considered for this analysis, where genes with a two-fold expression change at a significance level of 0.01 were considered as differentially expressed genes (DEGs). The similarity score per comparison was correlated with its total number of DEGs and its median fold change at a significance level of 0.01. Figure 3A,B shows the statistically significant correlations, indicating that there is a clear negative correlation between the score and both DEG parameters, ranging from −0.58 to −0.99. As overall dataset quality is a possible confounding factor for this analysis, we also performed correlations of the number of overlapping variants for each cell line as well as the different dates at which each dataset was submitted to the GEO. Neither of these factors had a significant effect on the analysis (STable 3). Enrichment analysis of manually curated KEGG functional units was also performed for DEGs of the significantly correlated cell lines, indicating that there is a generally higher proportion of enriched categories for low similarity scores than for high ones (SFigure 13).
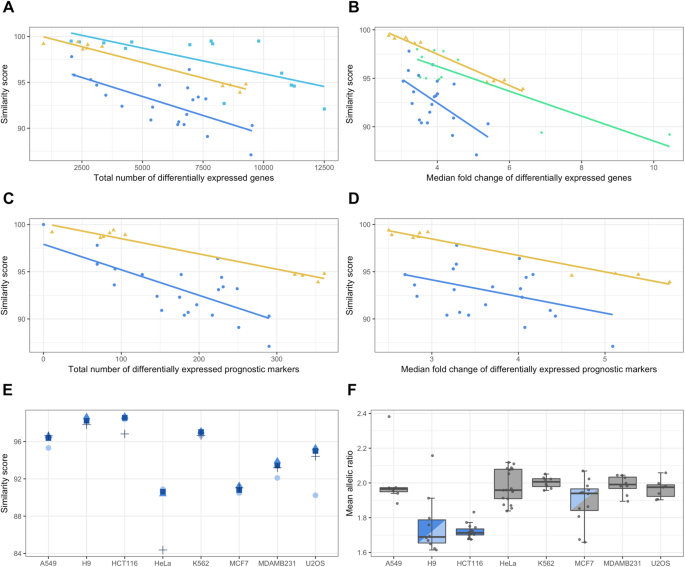
In order to investigate if the genetic heterogeneity present in cell line populations also affect the expression of genes known to be related to cancer we performed the same correlations as above, but for existing tissue-specific prognostic cancer markers previously published by the Human Protein Atlas project 31 . The H9, K562 and U2OS cells were not used for this analysis, as they do not have a corresponding HPA tissue. It is clear that the same relationship between the similarity score and DEGs still holds even for prognostic markers (Fig. 3C,D), indicating that the genetic heterogeneity can affect not only the global expression profile of the datasets, but also specific genes likely of great interest to researchers.
Another (albeit cruder) way of measuring gene expression similitude is the global correlation of all genes between pairwise samples. While the statistic rigorousness of a differential expression analysis (as above) is dismissed, such an analysis has the potential to give a wider perspective, as not only samples with replicates can be included. Indeed, the same pattern as above can be seen not only for four of the cell lines, but U2OS as well - the same holds true for correlations of only the prognostic markers (SFigure 15 and 16). These results demonstrate that the genetic heterogeneity present in cell populations has a profound effect on gene expression, both on the global level and for cancer-related genes.
In order to more fully investigate the possible origins of the genetic heterogeneity, we hypothesised that it might be due to genetic drift through either genomic instability, many years of culturing in and between different laboratories, or both. If so, a general accumulation of mutations is to be expected, particularly for low impact variants. As can be seen in Fig. 3E, the MODIFIER impact category has the lowest score in four of the cell lines, with a pronounced drop for HeLa in particular (and HCT116 to a lesser degree), indicating a higher proportion of mismatched lower impact variants. Indeed, HeLa has the highest proportions of MODIFIER variants, in addition to being the only cell line to have proportionally more MODERATE than LOW mismatching SNVs, possibly due to its ability to produce heterogeneously stable cell populations (SFigure 17D). Interestingly, the impact distribution of U2OS is clearly divergent, showing more mismatched HIGH impact variants, indicating that it might have larger phenotypic variation than the other cell lines (SFigure 17H).
Common causes of genetic drift are chromosomal instability (CIN) and abnormal chromosomal numbers (aneuploidy), both of which are recognised as hallmarks of cancer and are often found together 32,33 . In order to further investigate the presence of CIN and aneuploidy, we analysed the GEO data with an orthogonal RNA-seq method, which examines the allelic ratio (defined as major allele ÷ minor allele) across the entire transcriptome 34 . The mean allelic ratio of H9 and HCT116 (approximately 1.7) is significantly different from that of the other cell lines (closer to 2.0; Fig. 3F), indicating that a lower level of chromosomal aberrations may be the cause of their relative genomic stability compared to other cell lines (confidence intervals for each comparison are shown in SFigure 18). These results the genetic heterogeneity in public cell line data which can have profound effects on gene expression measurements.
A growing number of researchers use publicly available expression data to compare with their own results, but the accuracy of such analyses have yet to be assessed on a large scale. An increasingly apparent problem is that of the biological source of the samples used, as the results may be inaccurate or skewed if the datasets being compared are not genetically equivalent. While this applies to any kind of biological sample studied it is especially evident in cell line research, where the prevalence of contaminated, misidentified and otherwise unauthentic cells is increasing 8 . We thus sought to evaluate the comparability, authenticity and heterogeneity of RNA-seq cell line population data deposited in the GEO database using the methodology previously described 17 on a large scale, performing several thousands of pairwise comparisons of high-quality SNVs across 139 samples and 85 datasets from eight different cell lines of varying origin.
While comparing SNVs found in a dataset to those in the COSMIC database can be used for cell authentication, it is problematic for cell lines with fewer COSMIC variants; the H9 cell line with its practically non-existent COSMIC overlap is the prime (but not only) example of this. Any result based on a small number of variants is less reliable than one based on many variants; the A549 cell line, for example, has below 50 overlapping COSMIC variants in four out of seven datasets. The reasons for the low COSMIC overlap for the H9 cell line are unclear; it has the third most SNVs of all studied cell lines, and the transcriptome-wide analysis indicate that they are highly similar. An analysis of various COSMIC metadata for each cell line highlights H9 and HeLa as having an almost zero proportion of “verified” variants, i.e. variants that have been found in more than one dataset (SFigure 19). While this might be explained by numerous existing strains for HeLa, not so for H9. The reason for the low overlap of H9 may then be a combination of few COSMIC variants and a high level of unverified variants. Another issue with COSMIC authentications is the fact that most of the mismatched variants have a homozygous genotype according to the transcriptomic data. This is possibly due to allele-specific expression, which has been shown to be common and highly variable in humans, occurring in up to 22% of SNVs in human cell lines 35,36 . Such homozygous variants are thus expected when using a genome-based database like COSMIC, but make the results more difficult to assess. As the COSMIC database is manually curated, a positive result could be sufficient as an assessment of cell line authenticity, but drawing definitive conclusions from small variant sets remains problematic.
In order to alleviate these problems, we performed transcriptome-wide analyses on all the datasets investigated in this study in a pairwise manner, thus including the totality of SNVs and possible biological variation in each dataset. The most striking result is as previously mentioned for the H9 cell line, which has the highest median transcriptome-wide concordance of all the cell lines investigated (reaching 99.6% for several pairs), clearly showing that its datasets most likely originate from biologically equivalent sources; similar results were found for HCT116. While the concordance is a useful measure of similarity, it doesn’t account for cases with few variant overlaps, such as for the three datasets from H9, HeLa and MCF7. By unfavourably weighing the concordances of comparisons with few overlaps these datasets are more easily incorporated into the analysis, enabling consideration of a single parameter (the similarity score) rather than two (concordance and overlap). The discrepancy between the GEO metadata and the detailed information available in the corresponding publications of these datasets demonstrate the difficulty of performing a bioinformatic analysis across experiments, but also highlights how important dataset assessment is; such information is vital to any researcher wishing to analyse publicly available data.
Another striking finding is that a single MCF7 dataset is unequivocally more similar to HCT116 than to the other MCF7 datasets. There is no published article associated with this dataset, making a thorough investigation of the reasons for this disparity difficult to perform. It does, however, present a clear-cut case where use of public datasets without proper evaluation can lead researchers to draw erroneous conclusions. If such a dataset was to be used for e.g. a baseline for MCF7 cell lines against a drug treatment or for direct comparisons with other breast cancer cell lines the results would be meaningless at best and potentially disastrous at worst. Our analysis does not dismiss the data itself in its entirety, far from it: seeing as this dataset so clearly comes from HCT116 cells it could potentially be incorporated into experimental designs where this would be appropriate.
The stability of H9 and HCT116 has been previously shown, corroborating our results 37,38 . The variation seen in HeLa is unsurprising, given its history of producing stable, heterogenous cell populations 39 . While variations in HeLa’s karyotype have been inconsistently reported, it is clear that such changes have an effect on the phenotype of the cells 40 . Indeed, HeLa, MCF7 and MDAMB231 have been established to be genetically unstable 38,41,42 . While the datasets analysed herein were not chosen with suitability for differential expression as primary criteria, the correlations of similarity score versus the number of DEGs and fold change indicate that the genetic heterogeneity observed has a significant effect on gene expression in the H9, HCT116, MCF7, MDAMB231 and U2OS cell lines. This was also seen for cancer-related genes, as upwards of several hundreds of prognostic markers were differentially expressed between genetically dissimilar same-cell datasets. The magnitude of the DEGs are also significantly affected, as the median fold change for the same datasets can reach as high as well above five. While neither date of submission nor number of overlapping variants were significant confounding factors for this analysis, there might be others. As this analysis is performed on the SNV-level, larger copy number variations (CNVs) might affect the analysis. The mean allelic ratios for H9 and HCT116 does, however, indicate that this is likely not the case. Experimental factors not included in the GEO metadata might also play a role, such as RNA quality or the polymerase used for library preparation 43 . These results demonstrate that the genetic heterogeneity also affects genes that are likely to be key components of cancer research, thus representing a critical confounding factor for such studies. While the number of datasets and replicates puts a limitation on the enrichment analysis, there are indications that the genetic heterogeneity also has an effect on general cellular functions. These conclusions are corroborated by gene expression correlations, both globally and for the prognostic markers.
We hypothesised that this heterogeneity could be due to genetic drift as a result of genetic instability, supported by a greater proportion of mismatched low impact variants. The genetic instability that leads to genetic drift and accumulation of mutations in cancer may have several causes, commonly including chromosomal instability and aneuploidy 33 . The analysis of mean allelic ratios separate H9 and HCT116 as having fewer chromosomal aberrations than the others, explaining their high stability across datasets. Such biological information is highly pertinent for any researcher about to start a cell line-based study: what level of genetic stability is relevant for the scientific question examined? A stable cell line may be more suitable for studies examining a specific gene or pathway (increased comparability of datasets), while a more varied cell line might be more applicable for drug screenings (taking greater biological diversity into account). It is thus not only the patient- or organ-of-origin of a cell line that is important: careful consideration of the overall goal of the experimental design also needs to be taken into account. Additionally, scientific findings obtained using cell lines have to be carefully scrutinised in the light of the inherent intra- and inter-genetic variation encountered in cell line populations. The U2OS cell line, for example, has a higher proportion of mismatched higher impact variants than the others, meaning that special care needs to be taken to ensure that none of the variants affect genes important to the scientific question at hand. Such considerations highlight one of the major strengths of our general methodology: the ability to investigate the biological effects of any variant differing between samples. This is particularly relevant given the previously demonstrated varying phenotype for perfectly matched STR profiles of the MCF7 cell line 15 .
There are several factors that need to be considered in regards to the biological equivalency of two or more samples. The biology of any sample should be investigated by calculating its global similarity to a reference (preferably transcriptome-wide), if such is available. Any mismatched higher impact variants that might affect genes related to the biological question at hand need to be examined, as well as previously known variants. The impact of variants should also be investigated, in particular for those variants present in a pathway of interest. This is all given that the variant calling itself is performed with the most appropriate methods and software available, including choice of genome assembly and quality metrics, as done here. Not only cell line data could be analysed in this manner, but also data from tissues, cancer tumours or organoids. By following these guidelines (visualised in Fig. 4) researchers gain valuable information pertaining to heterogeneity, comparability and authenticity of their samples, leading to more well-informed choices regarding experimental designs and subsequently more biologically relevant conclusions.
In summary, we have performed a large-scale study of cell line heterogeneity in public RNA-seq data and highlighted important considerations for any researcher wishing to use such data in their analyses. We show that genetic heterogeneity in cell line populations has a great effect on gene expression measures as well as cancer hallmarks. The H9 and HCT116 cell lines are remarkably stable across many different studies and laboratories, possibly due to a smaller degree of chromosomal instability than the other cell lines (such as HeLa). We have demonstrated the importance of evaluating datasets by biological equivalency on both global and gene level as well as data quality and experimental conditions. Our methodology can help scientists make informed decisions vis-à-vis biological equivalency between both new sequencing data and any of the numerous publicly available datasets, representing a step forward both in terms of analysing dataset comparability, cell line heterogeneity and the conclusions drawn from their experiments.
Selection and acquisition of data from the GEO was performed using an array of tools and online software packages: the NCBI E-utilities 44 , the GEOquery R package 45,46 and the SRAdb R package 47 . The GEO was queried with the NCBI E-utilities for human RNA-seq datasets, and the metadata contained in the associated SOFT format files were parsed and filtered using a custom R script together with GEOquery. The SOFT files from GEO contain detailed metadata on each dataset not easily accessible through the online queries (such as cell type and experimental methods), making them a good choice for selection and filtering of metadata in a large-scale, programmatic manner. Only cell lines with at least ten RNA-seq datasets in the GEO and available in the COSMIC database 18 were considered. As metadata specific for the raw sequencing data (such as file size and the number of sequenced bases) is only available in the SRA, the SRA-specific metadata was collated with the GEO metadata using the SRAdb R package and the NCBI E-utilities. This process was performed on November 16th, 2016; the final metadata contains 80 different metadata fields per sample (such as study and sample IDs, protocols, treatments and sequencing platforms) and can be found in SData 1, while details on each cell line are available in SData 2.
Analysis of SNVs and cell line authentication of the biological samples analysed in the selected datasets was performed as previously described 17 . Briefly, raw data from each sample was downloaded from the SRA using the fastq-dump utility from the SRA toolkit, followed by read alignment, variant calling (including confident homozygous reference sites) and filtering using STAR, GATK and in-house scripts, respectively 46,48,49 . In addition to comparisons of cell line-specific SNVs that were downloaded from the COSMIC database, the transcriptome-wide variants were also compared in a pairwise manner to each other. All parts of the analysis utilised the GRCh38 assembly. Files containing the results of both the COSMIC and transcriptome-wide comparisons are included in SData 3–6.
Gene expression estimation was performed using the Kallisto (0.43.0) 27 and TXimport (1.2.0) 28 software, followed by differential gene expression analysis with edgeR (3.16.1) 29 . Genes with fold changes greater than two and FDR ≤ 0.01 were counted as differentially expressed. The list of prognostic markers was downloaded from table S8 in the Pathology Atlas publication, and DEG analysis was performed as above 31 . Gene expression correlations were performed using log-normalisation of (TPM + 1). KEGG Module enrichment was performed using the clusterProfiler (3.5.5) 50 R package. Data on DEGs, expression correlations and enrichments is available in SData 7–10, while a list of all prognostic markers is available in SData 11. The cell lines H9, K562 and U2OS were not used for investigating prognostic markers, as they do not have a corresponding HPA tissue.
The eSNP-Karyotyping analysis 34 was performed as previously described on SNVs that passed all of the following GATK variant calling filtering criteria: Fisher strand value ≥ 30, quality by depth ≥ 2, clusters with no more than 2 variants within a 35 base pair window, total allelic depth ≥ 10 and minor allelic ratio ≥ 0.2. Moving medians of allelic ratios were calculated across all chromosomes, yielding a measure of the mean allelic ratio across the entire transcriptome. All statistical testing was performed at significance levels of 0.01; a detailed RMarkdown document for reproducing all figures is available in the supplementary information.
This work was supported by the European Community 7 th Framework Program under grant agreement no. 278568 “PRIMES”. We would like to acknowledge Anders Andersson, Olof Emanuelsson and Mathias Uhlén for discussions during the work on this study, as well as support from Science for Life Laboratory, the National Genomics Infrastructure and Uppmax for providing assistance in computational infrastructure.